What Is the Fear and Greed Index?
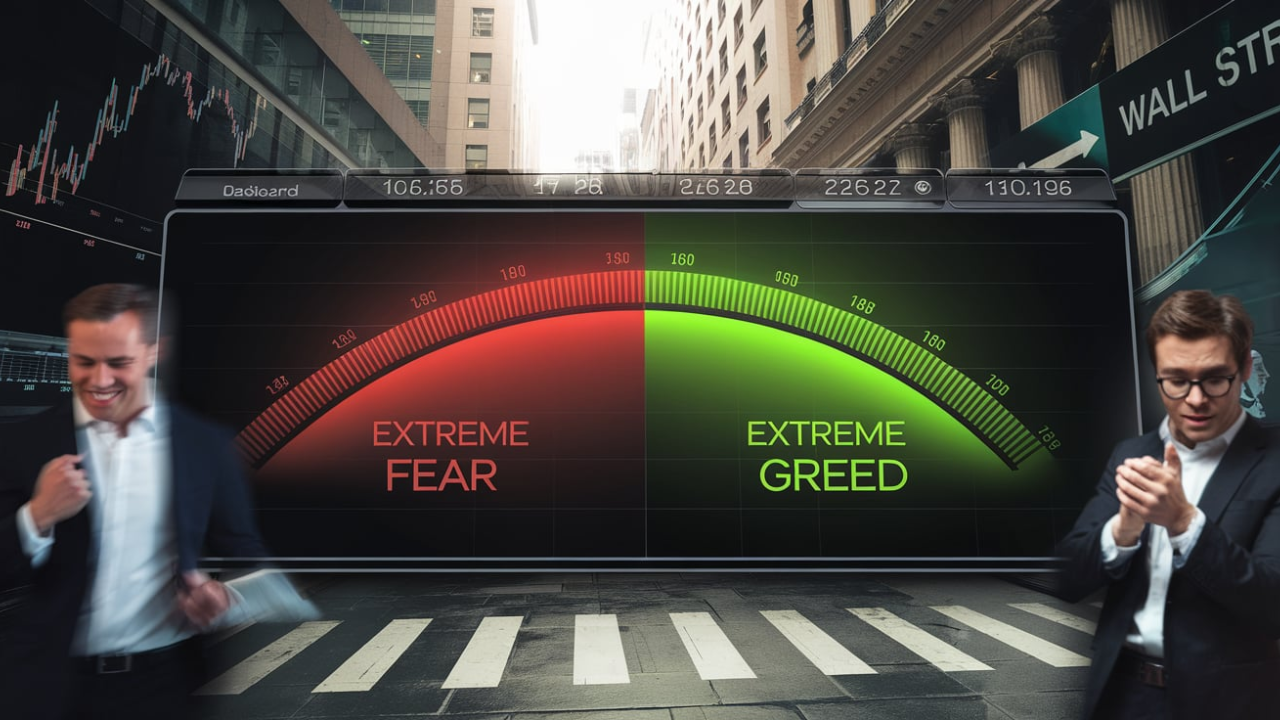
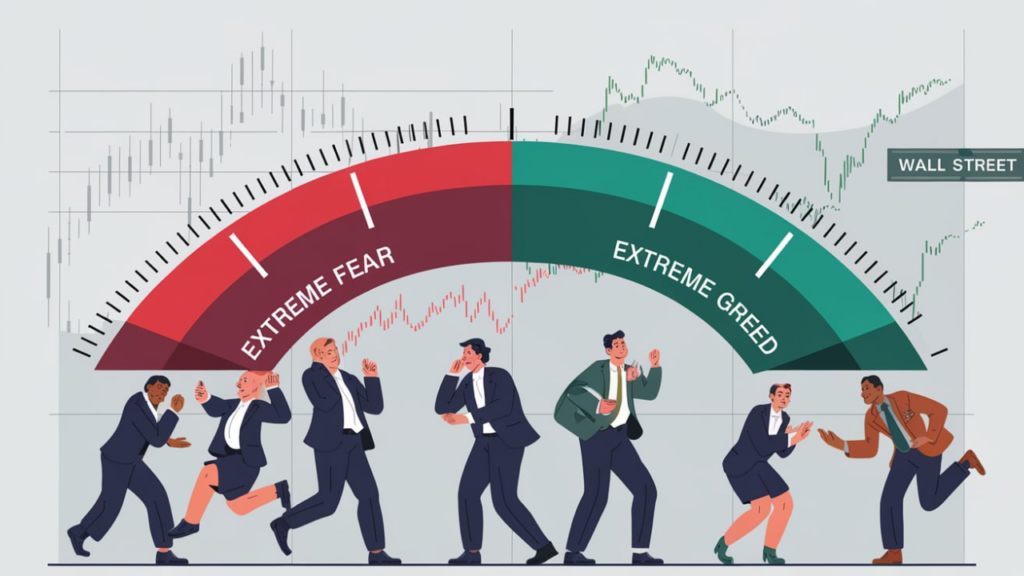
The Fear and Greed Index measures investor sentiment by analyzing various market factors. It helps traders and investors understand whether the market is driven by fear or greed at any moment. The index ranges from 0 to 100, with lower values indicating extreme fear and higher values signifying extreme greed.
Table of Biography for “Fear and Greed Index”
| Attribute | Details |
|---|---|
| Full Name | Fear and Greed Index |
| Created By | CNNMoney |
| Purpose | Measures investor sentiment based on market conditions |
| Range | 0 to 100 (Extreme Fear to Extreme Greed) |
| Main Indicators | Stock price momentum, market volatility, safe-haven demand, options activity, market breadth, junk bond demand, Google search trends |
| Category | Market Sentiment Indicator |
| Usage | Helps investors determine if the market is driven by fear or greed |
| Risk Factors | Short-term focus, emotional bias, external economic events |
| Popular Among | Traders, Investors, Market Analysts |
| Best Time to Use | During |
Why Does the Fear and Greed Index Matter?
Market sentiment plays a crucial role in investment decisions. Extreme fear can lead to panic selling, while excessive greed often results in overvaluation and market bubbles. By monitoring the Fear and Greed Index, investors can assess potential market risks and opportunities and avoid impulsive decisions based on emotional reactions.

How Is the Fear and Greed Index Calculated?
The index is derived from multiple indicators, including:
- Stock Price Momentum – Measures the performance of major stock indices like the S&P 500.
- Market Volatility – Assessed through the CBOE Volatility Index (VIX), which reflects market uncertainty.
- Safe-Haven Demand – Analyzes how much investors shift towards safe assets like bonds.
- Put and Call Options – Examines options trading activity to determine investor outlook.
- Market Breadth – Tracks the number of advancing versus declining stocks.
- Junk Bond Demand – Measures investor appetite for high-risk bonds.
- Google Trends Data – Searches related to financial terms indicating fear or greed.
What Do Different Levels of the Fear and Greed Index Indicate?
The interpretation of the index is straightforward:
- 0-25 (Extreme Fear): Market pessimism is high, and stocks may be undervalued.
- 26-49 (Fear): Investors are cautious, and prices may be pressured downward.
- 50 (Neutral): Balanced market sentiment with no extreme behaviors.
- 51-74 (Greed): Investors are optimistic, and prices may rise steadily.
- 75-100 (Extreme Greed): Market euphoria is intense, and assets may be overbought.
How to Use the Fear and Greed Index in Investing
Investors can leverage this index in multiple ways:
- Contrarian Investing: Buy when the market is in fear and sell when greed dominates.
- Risk Management: Reduce exposure when extreme greed appears and consider buying when extreme fear takes over.
- Market Timing: Use the index to gauge potential corrections or recoveries.
Limitations of the Fear and Greed Index
Despite its usefulness, the index has certain limitations:
- Short-Term Focus: It reflects market sentiment in the short term and may not predict long-term trends.
- Emotional Influence: The index is based on psychological factors, which can be unpredictable.
- External Events: Major economic or geopolitical events can override the index’s sentiment.
Deduction
Also read: Kishu Inu Coin: The Dogecoin Rival With a Unique Twist
The Fear and Greed Index is valuable for understanding market sentiment and making informed investment decisions. While it should not be the basis for trading strategies, incorporating it with other fundamental and technical analyses can provide deeper market insights. Investors can use this index wisely to navigate market volatility with greater confidence and discipline.